
Monitor tab
Release a feature, then jump over to the new Monitor tab to view exposure, adoption, and feedback in real-time.
Use the Monitor tab to catch issues and iterate faster. A live chart displays feature exposure and use over the last hour, which updates in real-time - handy for monitoring usage after you set a flag to GA. Or you can review historic data from the last week, month, quarter, or 6 months.
Then click through to lists of companies who have seen or tried a feature, so you know who is best to reach out to for feedback.
We surface all recent feedback on the Monitor tab, too, including satisfaction scores and feedback text alongside the user’s name and account.
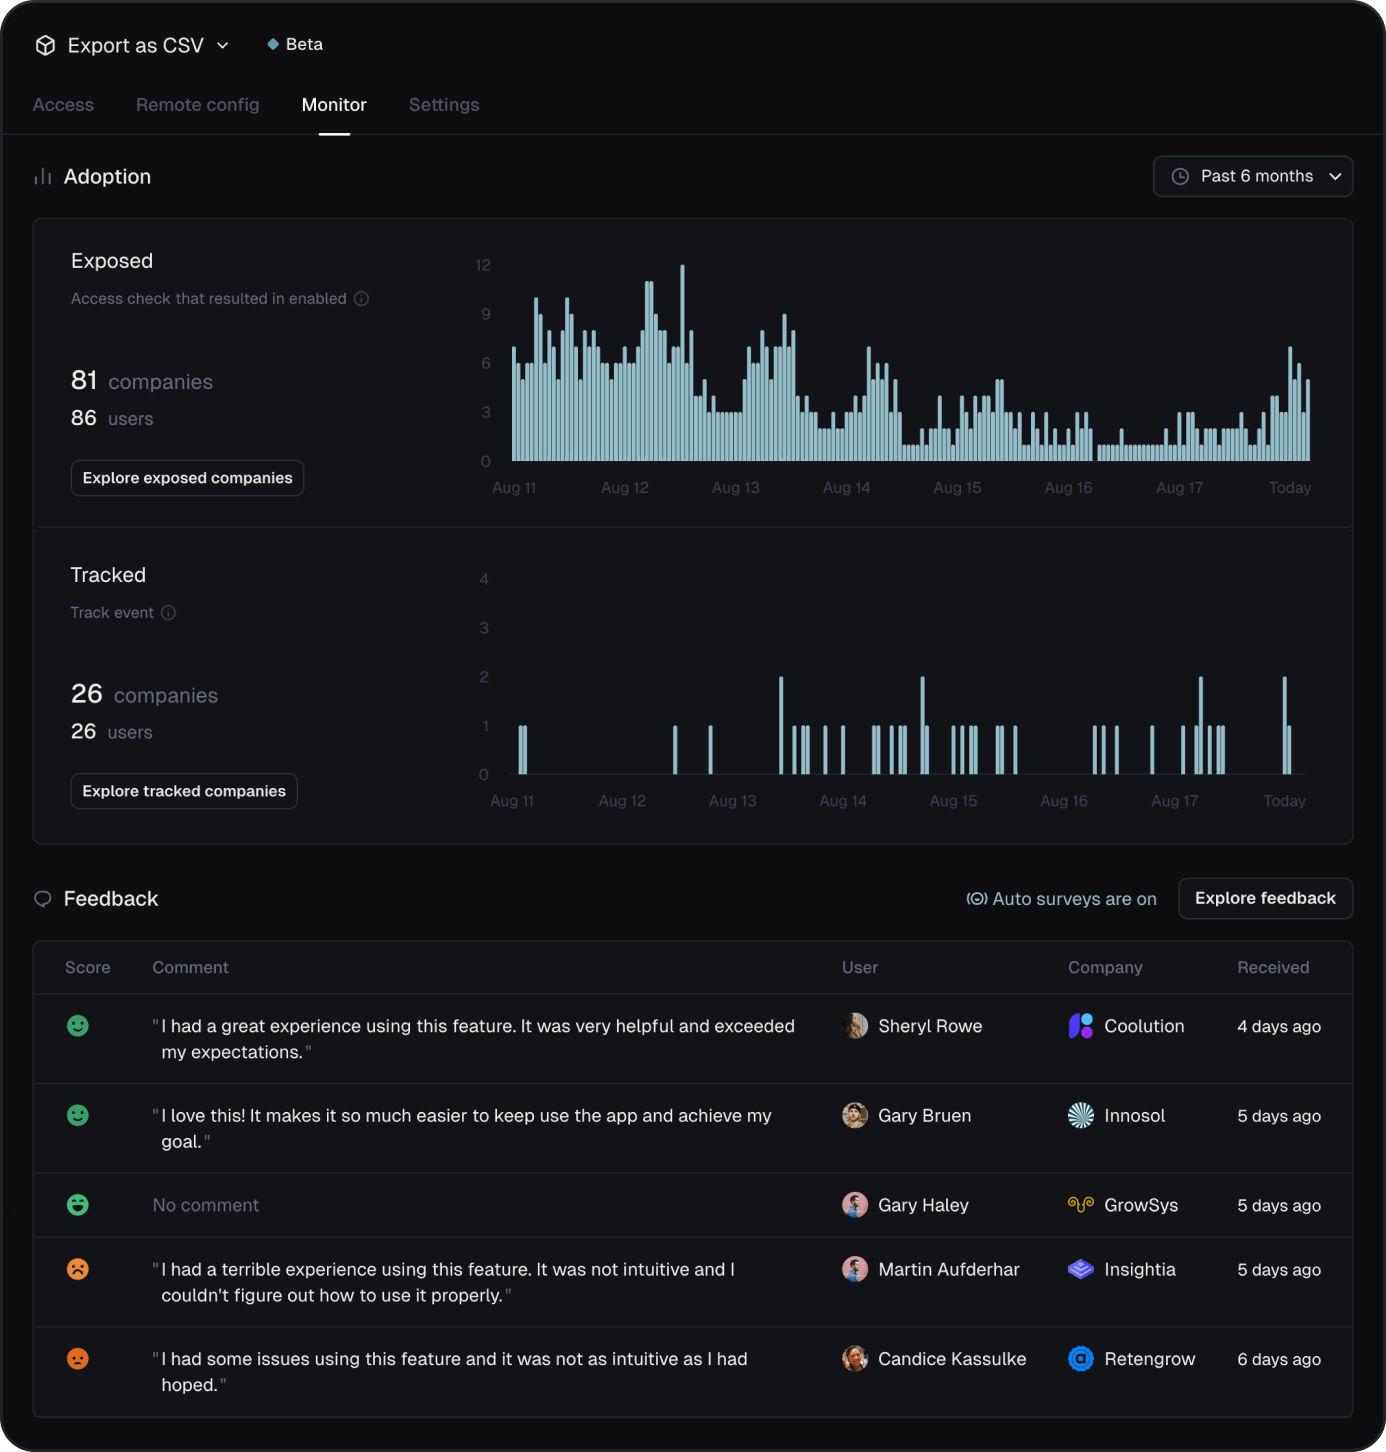
The Monitor tab replaces STARS with a simplified view that combines the prior Adopted and Feedback tabs into a single page, alongside new metrics like Exposed.
For more details, check out the documentation or select a feature under Features to try out the Monitor tab for yourself.